Data Structures I - NTIN066 - Winter Semester 2015/2016 - 3rd homework
Deadline: 1st December 2015.
How to submit: As an attachment of email to ds1@kam.mff.cuni.cz.
The rules
- All the code which you submit must be original created by you without any external "inspiration".
- Do not share your solution with anyone else so that your code does
not become someone else's "inspiration". The only exception to this
rule is submitting the assignment.
- Feel free to discuss the homework and possible approaches with
others. However, you should observe the above rules about not sharing
any code. That is, discussion
is fine as long as you write your own code by yourself!
- Your solution should be written in either C/C++ (recommended), Java or C#.
- Use only standard constructs of your programming language. Do not use any special library functions.
The code dealing with the data structure has to be written solely by you.
- Solutions deviating from the above rules will not be accepted.
The description of the problem
Implement two versions of Splay trees, the classical one which uses double rotations and a naive version which uses only the simple rotation on the whole path from a splayed node to the root.
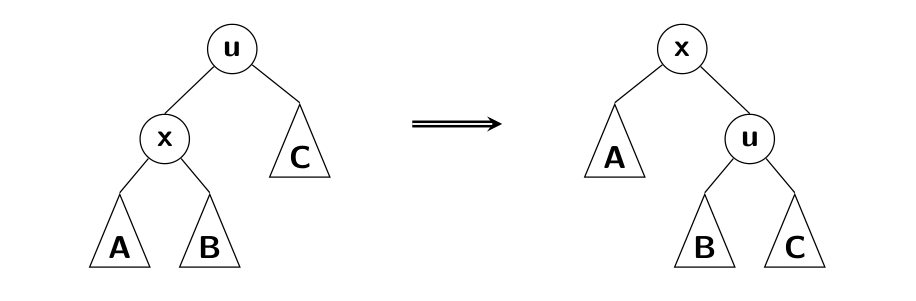
|
| Simple rotation |
Examine behavior of both data structures on test data generated by the program
described below. The test data contain sets of varying sizes with two kinds of operations:
- uniform subset test: operation Find uniformly searches for a random element from a fixed subset of inserted items of size T;
- sequential test: a specific sequence of operations Find.
For each set, measure the average length of paths from the root to the given splayed node.
Generating the data
Use the program
/afs/ms.mff.cuni.cz/u/b/babkm5am/ds1/hw3/splaygen in the unix lab Rotunda.
Run it with the following parameters:
-s XX, where XX are the last two
digits of your student ID;-t T, where T is the size of a searched subset;-b, if you want to generate the sequential test.
The output of the generator is a text file. Each line specifies
a single operation on the tree:
# N: start a test for a set of size N –
discard the previous tree and create a new one (the set size can be useful for plotting);I X: insert a key X to the tree
(if the key is already present, ignore this operation);F X: search a key X in the tree.
A single invocation of the generator creates a sequence of tests ranging roughly from 1000 to 1000000 elements.
Resulting graphs
For each kind of test draw a plot showing the dependency of the average length of the path Find on the size N:
- For the classical Splay tree and uniform subset test, plot six curves, each for one value of T from {10,100,1000,10000,100000,1000000}.
- As the previous graph, but using the naive implementation of Splay trees.
- Joint plot of the first and the second plots containing
three curves for the classical and another three curves for the naive
version for values T from {100,10000,1000000}.
- For the classical and naive version, plot the average length of the path during the sequential test.
Try to explain the differences in behavior of two versions of the tree.
Example input
# 3
I 1
I 2
I 0
F 1
F 0
F 2
# 4
I 2
I 3
I 0
I 1
F 2
F 0
F 2
F 3
Submitting your solution
Send an e-mail with subject of the form 'HW3-55973318' (i.e., HW3-student ID)
with the following attachments:
- source code used to get your results (in case it consists of multiple
files, please use ZIP or TAR to pack them),
- a PDF with plots and comments.
The body of your e-mail shall have the following form:
Name: Jirka Fink
Pseudonym for web results: Guybrush Threepwood
Tutorial section: Monday-12:20-odd